Multi channel processing#
WMXZ (14-Aug-2024)
Sound source distance#
Let the location of hydrophone \(i\) be \(h_i = (x_i,y_i.z_i)\) and the source location be \(s=(s_x,s_y,s_z)\) then the distance of the source from the hydrophone is related by
which becomes
or in short
Having more then 1 hydrophone, then for any pair of hydrophones \((h_i, h_j)\) one can form the difference obtaining
Noting that \(R_i^2-R_j^2=(R_j+(\delta R_{ij}))^2-R_j^2 = 2(\delta R_{ij})R_j+(\delta R_{ij})^2 \)
one gets the linear equation
or, by putting the unknown source location to the left side and dividing by 2
Direction finding#
Given
Assume that all phones are closely spaced compared to distance to source
and noting that
or equivalently with \(s=|s|\hat{s}\) and dividing by \(|s|\)
then
Let
then
which for \(|s| \to \infty\) becomes an equation that may be used to estimate the direction \(\beta\) to a distant sound source.
This equation is the basis for all direction finding algorithms
Multi-phone direction finding#
Let
and assume an array of \(n+1\) phones then one can form \(npp=(n+1)n/2\) different pairs of phones resulting to a system of \(npp\) equations
With
the solution for the source direction vector \(\hat{s}\) becomes
It should be noted that the path difference \(\delta R_{ij}=R_i-R_j\), where \(R_j\) is the path to the reference phone, is negative if the sound arrives first to phone at \(h_i\) and then to the one at \(h_j\), as it would for \(\cos{\beta}>0\).
Time delay based direction finding#
Assume that the travel path difference \((\delta R_{ij})\) is based on time-delay estimation
with \(c\) being the sound speed and \((\delta t_{ij})\) the measured time delay of the signal.
Phase based direction finding#
Assume that the measured time delay between two hydrophones \(\delta t\) is small enough that a sinusoidal signal
As in inverse sinus results in values between \(\pm \pi\) we can conclude that phase processing is possible for
The maximal delay between two hydrophones seperated by \(d_{ij}\) is
so that phase processing is possible for all frequencies \(f\) for which
and the time delay of a signal is equivalent to a phase shift of the signal.
Given a time delay \((\delta t_{ij})\), the phase shift is given by
import numpy as np
import matplotlib.pyplot as plt

import wavio as wv

import scipy.signal as signal

plt.rc('font', size=15)
np.random.seed(43)
#hydrophone configuration
dz=np.sqrt(0.5)
#
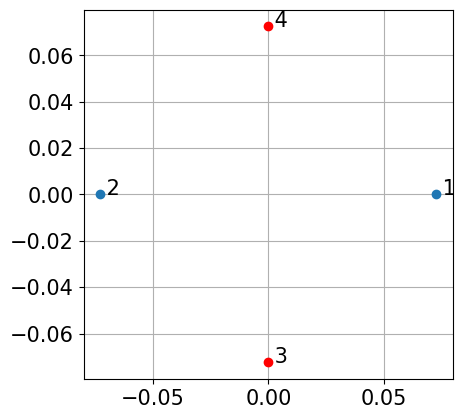
# tetraheder
ho=np.array([[1,0,-dz],[-1,0,-dz],[0,-1,dz],[0,1,dz]])*0.0725

hsel=np.array([[1,0],[2,0],[3,0],[2,1],[3,1],[3,2]])    # hsel[:,1] is reference
nc=hsel.shape[0]
D=ho[hsel[:,0],:]-ho[hsel[:,1],:]
L=np.sqrt(np.sum(D**2,1))
print(L,'m')
print(0.75/L, 'kHz')
DI=np.linalg.pinv(D)
Lm=np.max(L)
#
plt.plot(ho[:2,0],ho[:2,1],'o')     # bottom
plt.plot(ho[2:,0],ho[2:,1],'ro')    # top
plt.text(ho[0,0],ho[0,1],' 1')
plt.text(ho[1,0],ho[1,1],' 2')
plt.text(ho[2,0],ho[2,1],' 3')
plt.text(ho[3,0],ho[3,1],' 4')
plt.grid(True)
plt.gca().set_aspect('equal')
plt.show()
[0.145 0.145 0.145 0.145 0.145 0.145] m
[5.17241379 5.17241379 5.17241379 5.17241379 5.17241379 5.17241379] kHz
# Overlap-add FIR filter, (c) Joachim Thiemann 2016
# https://github.com/jthiem/overlapadd/blob/master/olafilt.py
#
# modified by WMXZ to work on multi-channel data
#
def fft_filt(b, x, zi=None, nh=0):
    """
    Filter a one-dimensional array with an FIR filter

    Filter a data sequence, `x`, using a FIR filter given in `b`.
    Filtering uses the overlap-add method converting both `x` and `b`
    into frequency domain first.  The FFT size is determined as the
    next higher power of 2 of twice the length of `b`.

    Parameters
    ----------
    b : one-dimensional numpy array
        The impulse response of the filter
    x : one-dimensional numpy array
        Signal to be filtered
    zi : one-dimensional numpy array, optional
        Initial condition of the filter, but in reality just the
        runout of the previous computation.  If `zi` is None or not
        given, then zero initial state is assumed.
    nh : time shift of result (group delay)

    Returns
    -------
    y : array
        The output of the digital filter.
    zf : array, optional
        If `zi` is None, this is not returned, otherwise, `zf` holds the
        final filter delay values.
    """

    if x.ndim==1: x=x.reshape(-1,1)
    if b.ndim==1: b=b.reshape(-1,1)
    L_I = b.shape[0]
    # Find power of 2 larger that 2*L_I (from abarnert on Stackoverflow)
    L_F = 2<<(L_I-1).bit_length()
    L_S = L_F - L_I + 1
    L_sig,N_sig = x.shape
    offsets = range(0, L_sig, L_S)

    # handle complex or real input
    if np.iscomplexobj(b) or np.iscomplexobj(x):
        fft_func = np.fft.fft
        ifft_func = np.fft.ifft
        res = np.zeros((L_sig+L_F,N_sig), dtype=np.complex128)
    else:
        fft_func = np.fft.rfft
        ifft_func = np.fft.irfft
        res = np.zeros((L_sig+L_F,N_sig))

    FDir = fft_func(b, n=L_F,axis=0)

    # overlap and add
    for n in offsets:
        res[n:n+L_F,:] += ifft_func(fft_func(x[n:n+L_S,:], n=L_F,axis=0)*FDir,axis=0)

    if zi is not None:
        res[:zi.shape[0],:] = res[:zi.shape[0],:] + zi
        zi=res[L_sig:,:]
        return res[nh:nh+L_sig,:],zi
    else:
        return res[nh:nh+L_sig,:]

def quadInt(uu,imx,nd1):
    # three point quardatic interpolation
    # to find location and value of interpolated maxima
    nc=len(imx)
    uo=uu[imx,range(nc)]
    um=uu[imx-1,range(nc)]
    up=uu[imx+1,range(nc)]

    b=(up+um-2*uo)/2;

    xo=(um-up)/(4*b);
    yo=uo-b*xo**2;

    ux=np.zeros((nc,2))
    ux[:,0]=xo+imx-nd1
    ux[:,1]=yo
    return ux

def sim_array(yy,DS,noise):
    # delay signal according to array geometry
    # (use fractional delay with sinc function)
    kk=np.arange(-10,11,1);
    ss=np.zeros((len(yy),len(DS)))
    for ii in range(len(DS)):
        ss[:,ii]=fft_filt(np.sinc(kk+DS[ii]),yy)[:,0]

    if noise>0:
        nn=np.random.normal(scale=noise, size=ss.shape)
        ss +=nn
    return ss
Phase based direction finding#
Tonal#
FM modulation#
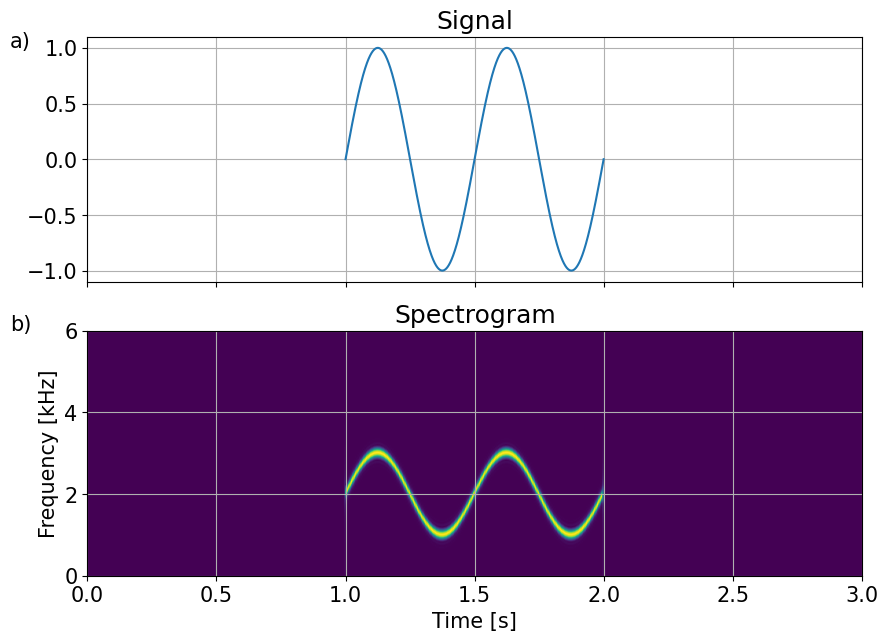
#%% signal generation
fs = 96000 # sampling frequency
tt = np.arange(0, 1, 1/fs) # time axis

f_sig = 2 # base signal frequency
x_m = np.sin(2*np.pi*f_sig*tt) # base signal
y_m = -np.cos(2*np.pi*f_sig*tt) # integrated base signal
z_m = (2*np.pi*np.cumsum(x_m)/fs-1/f_sig)*f_sig # integrated base signal

if 0:
    plt.plot(tt,y_m)
    plt.plot(tt,z_m)
    plt.grid(True)
    plt.show()

#%% modulation
fc = 2000 # carrier frequency
fm = 1000 # modulation t_t = fc +- fm
f_d = fm/f_sig
#
# phi = 2*pi*(fc*tt + fm*integral(x_m))
phi = 2*np.pi*fc*tt + f_d*z_m # phase

ss = np.sin(phi) # modulated signal

xx=np.concatenate((np.zeros(fs),ss,np.zeros(fs)))

nw=1024
nover=nw//2
nfft=nw*4
f,t,Q0 = signal.stft(xx,fs=fs,nperseg=nw,noverlap=nover,nfft=nfft)#,

ext=[t[0],t[-1],f[0]/1000,f[-1]/1000]

#%% plotting
fig, ax = plt.subplots(2, 1, num=0, clear=True, sharex=True, figsize=(10,7))

ax[0].set_title('Signal')
ax[0].plot(1+tt, x_m)
ax[0].grid(True)
ax[0].text(-0.3,1,'a)')

ax[1].set_title('Spectrogram')
ax[1].imshow(np.abs(Q0), origin='lower', aspect='auto',extent=ext)
ax[1].set_ylim(0,6)
ax[1].grid(True)
ax[1].set_ylabel('Frequency [kHz]')
ax[1].set_xlabel('Time [s]')
ax[1].text(-0.3,6,'b)')
plt.show()
def cosd(x): return np.cos(x*np.pi/180)
def sind(x): return np.sin(x*np.pi/180)
def array_delay(S,ho,fs):
    DC=np.sum(ho*S,1)
    DT=DC/1.500         # ms
    DS=DT*fs/1000
    return DS,DT

#delay signal according to array geometry
azo=-60
elo=+60
S =np.array([cosd(azo)*cosd(elo),sind(azo)*cosd(elo), sind(elo)])
DS,DT=array_delay(S,ho,fs)
print(DT, 'ms')
print(DS, 'samples')
[-0.01751467 -0.04168133  0.05052695  0.00866905] ms
[-1.6814081  -4.0014081   4.85058704  0.83222916] samples
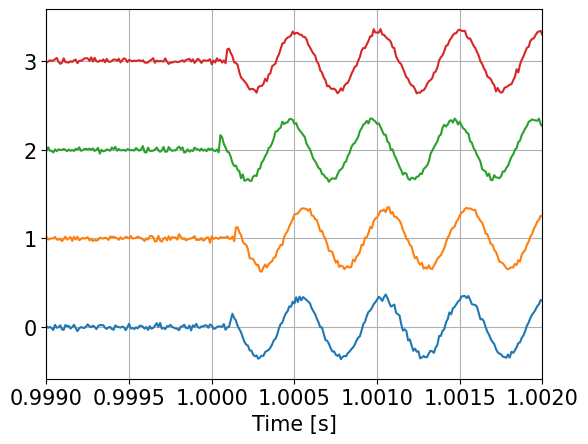
# simulate array measurements
noise=0.05
ss=sim_array(xx,DS,noise)
ts=np.arange(ss.shape[0])/fs
#
plt.plot(ts,0.4*ss/np.max(ss)+np.ones((ss.shape[0],1))*np.arange(len(DS)));
plt.grid(True)
plt.xlim(1.0-0.001, 1.0+0.002)
plt.xlabel('Time [s]')
plt.show()
Phase shift method#
#phase process
# generate analytic signal
zz=signal.hilbert(ss,axis=0)
#
ns=np.shape(hsel)[0]
DPhi=np.log(zz[:,hsel[:,1]]/zz[:,hsel[:,0]]).imag       # hp1 // hp0 !!!
#
if 0:
    plt.plot(ts,DPhi)
    plt.grid(True)
    plt.xlim(1.0-0.02, 2.0+0.02)
    plt.xlabel('Time [s]')
    plt.show()
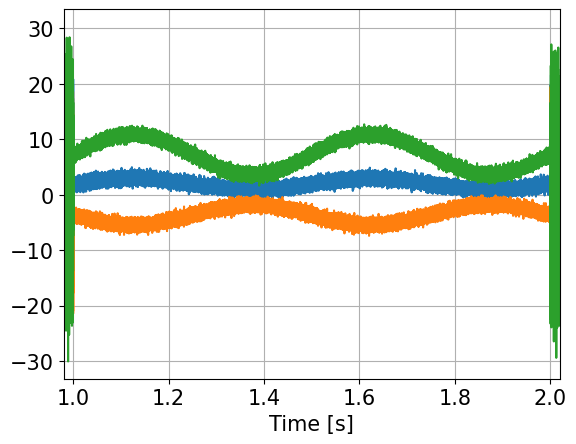
# project to 3-d coordinates
U=-DPhi@DI.T

if 1:
    plt.plot(ts,U)
    plt.grid(True)
    plt.xlim(1.0-0.02, 2.0+0.02)
    plt.xlabel('Time [s]')
    plt.show()
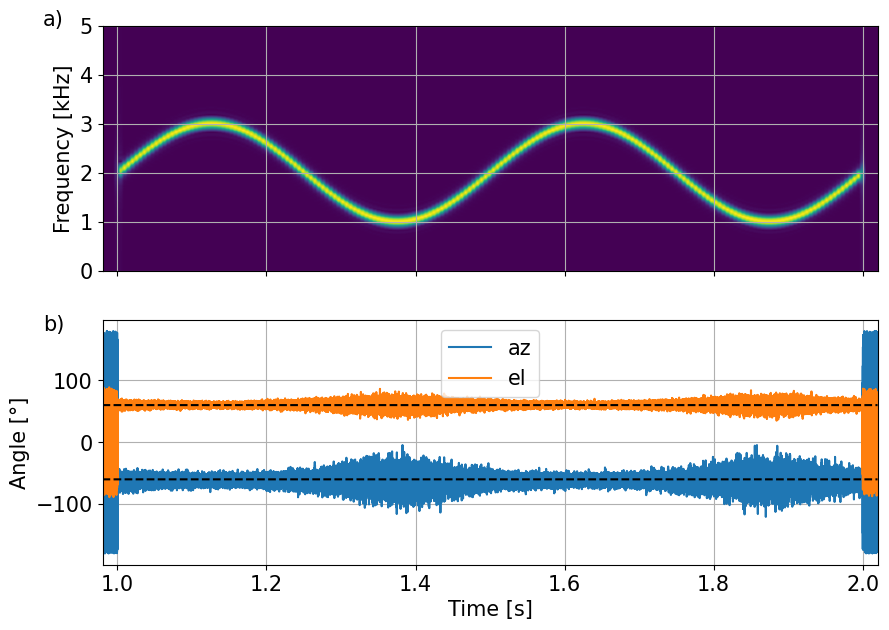
# angle estimation
azx=180/np.pi*np.arctan2(U[:,1],U[:,0])
elx=180/np.pi*np.arctan2(U[:,2],np.sqrt(U[:,0]**2+U[:,1]**2))
#
fig, ax = plt.subplots(2, 1, num=0, clear=True, sharex=True, figsize=(10,7))
ax[0].imshow(np.abs(Q0),origin='lower', aspect='auto',extent=ext)
ax[0].set_ylim(0,5)
ax[0].grid(True)
ax[0].set_xlim(1.0-0.02, 2.0+0.02)
ax[0].set_ylabel('Frequency [kHz]')
ax[0].grid(True)
ax[0].text(0.9,5,'a)')

ax[1].plot(ts,azx,label='az')
ax[1].plot(ts,elx,label='el')
ax[1].plot(ts,azo+0*ts,'k--')
ax[1].plot(ts,elo+0*ts,'k--')
ax[1].set_xlim(1.0-0.02, 2.0+0.02)
ax[1].grid(True)
#plt.ylim(-10,10)
ax[1].set_xlabel('Time [s]')
ax[1].set_ylabel('Angle [°]')
ax[1].legend()
ax[1].text(0.9,180,'b)')

plt.show()
Spectrogram method#
def getIntensity(xx,DI,hsel,fs,nw,nfft):
    f,t,Q=signal.stft(xx,fs=fs,nperseg=nw,noverlap=nw//2,nfft=nfft,axis=0)
    Q=Q.transpose(0,2,1)
    C = -np.imag(Q[:,:,hsel[:,0]]*np.conjugate(Q[:,:,hsel[:,1]]))
    I = -C@DI.T
    return f,t,I

nw=1024
nfft=nw*4
f,t,I=getIntensity(ss,DI,hsel,fs,nw,nfft)
#
In=np.sqrt(np.sum(I**2,2))
In[ 0,:]=In[ 1,:]
In[-1,:]=In[-2,:]
I /= In.reshape(In.shape[0],In.shape[1],1)
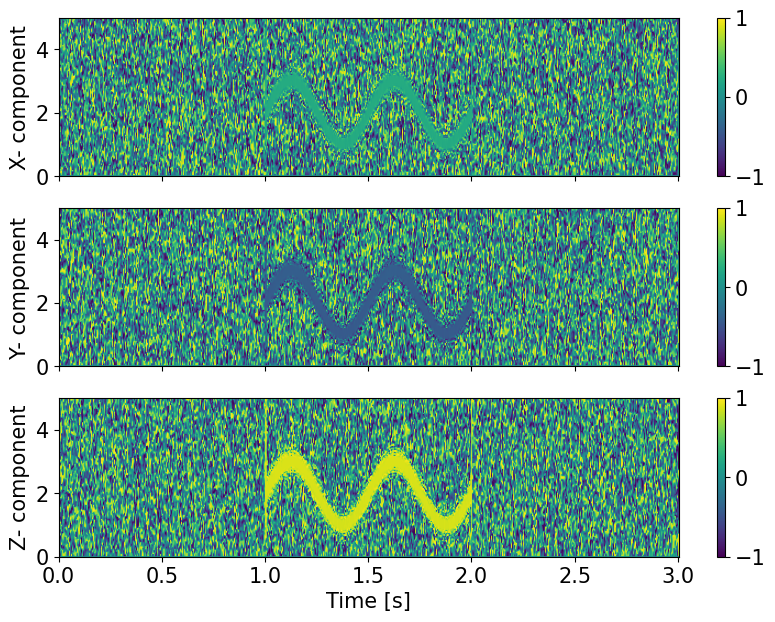
fig, ax = plt.subplots(3, 1, num=0, clear=True, sharex=True, figsize=(10,7))
ylabels=['X','Y','Z']
for ii in range(3):
    im=ax[ii].imshow(I[:,:,ii],origin='lower', aspect='auto',extent=ext,clim=[-1,1])
    ax[ii].set_ylim(0,5)
    ax[ii].set_ylabel(ylabels[ii]+'- component')
    plt.colorbar(im)
ax[2].set_xlabel('Time [s]')
plt.show()
## angle estimations
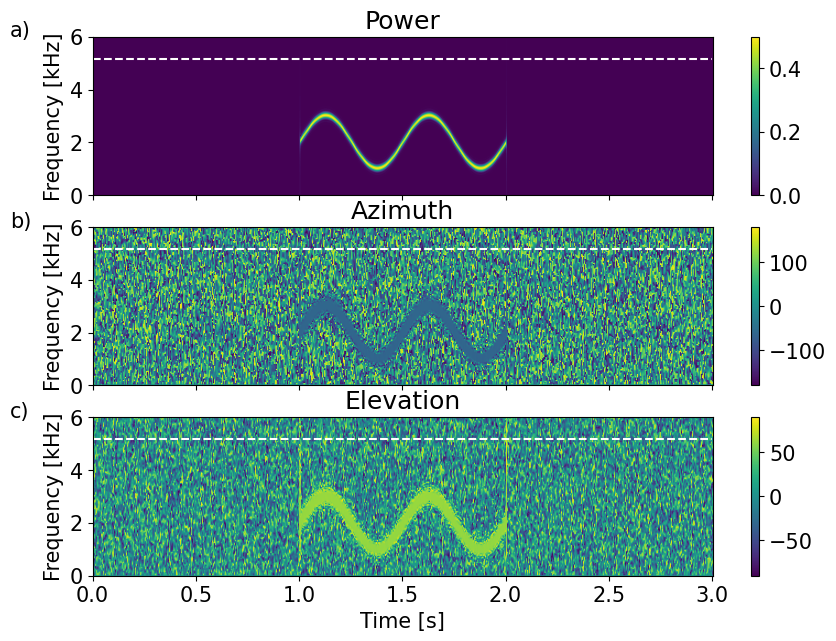
Azx=180/np.pi*np.arctan2(I[:,:,1],I[:,:,0])
Elx=180/np.pi*np.arctan2(I[:,:,2],np.sqrt(I[:,:,0]**2+I[:,:,1]**2))
#
yl=[0,6]
xto=-0.4
fig, ax = plt.subplots(3, 1, num=0, clear=True, sharex=True, figsize=(10,7))
im=ax[0].imshow(np.abs(Q0),origin='lower', aspect='auto',extent=ext)
ax[0].hlines(0.75/Lm,0,3,colors='w',linestyles='--')
ax[0].set_ylim(yl)
ax[0].set_ylabel('Frequency [kHz]')
ax[0].set_title('Power')
plt.colorbar(im)
ax[0].text(xto,6,'a)')
#
im=ax[1].imshow(Azx,origin='lower', aspect='auto',extent=ext,clim=(-180,180))
ax[1].hlines(0.75/Lm,0,3,colors='w',linestyles='--')
ax[1].set_ylim(yl)
ax[1].set_ylabel('Frequency [kHz]')
ax[1].set_title('Azimuth')
plt.colorbar(im)
ax[1].text(xto,6,'b)')
#
im=ax[2].imshow(Elx,origin='lower', aspect='auto',extent=ext,clim=(-90,90))
ax[2].hlines(0.75/Lm,0,3,colors='w',linestyles='--')
ax[2].set_ylim(yl)
ax[2].set_xlabel('Time [s]')
ax[2].set_ylabel('Frequency [kHz]')
ax[2].set_title('Elevation')
plt.colorbar(im)
ax[2].text(xto,6,'c)')
#
plt.show()
Broadband (ship) noise#
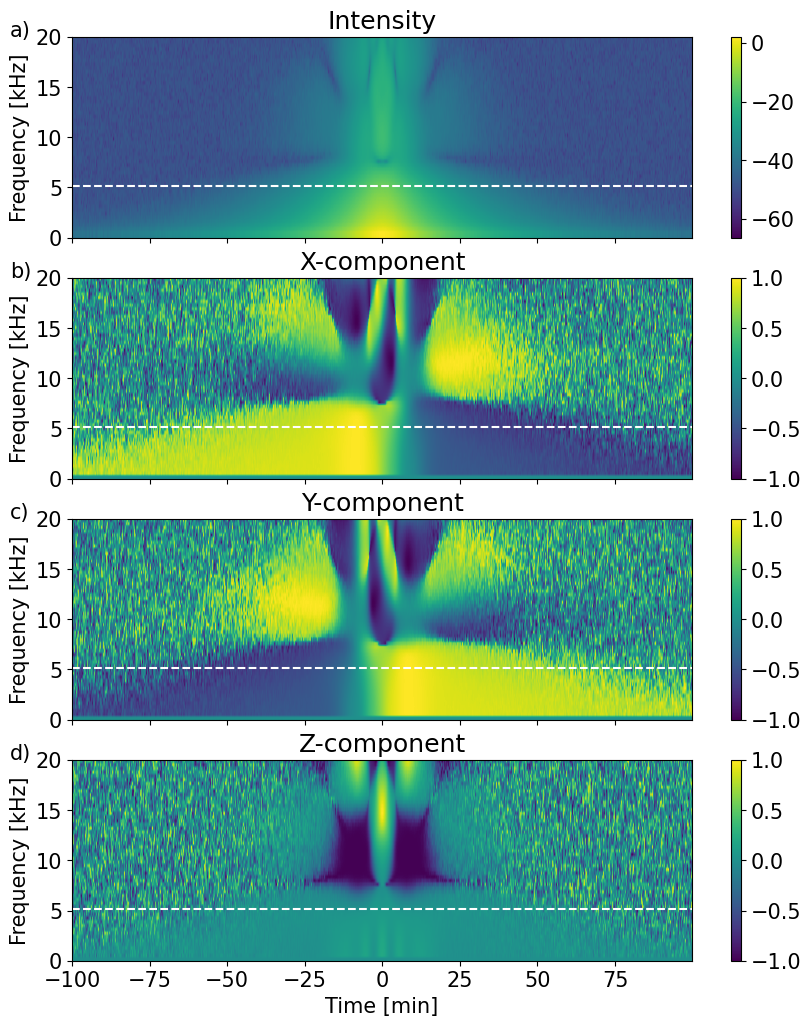
To simultate a colored, i.e. not white, noise sequence, white noise spectrum \(Y(f)\) is first modeled as having uniform random phase \(U(N_f)\)
where \(N_f\) is the number of (positive) frequenency bins.
The white noise spectrum is then wheighted by the square-root of the desired colored power spectrum.
The desired colored noise \(n\) is then obtained by the inverse Fourier Transform of the colored noise spectrum.
where \(W(f)\) is the amplitude weghting function and \(W(f)_{\text{RMS}}\) is the root-mean-square of the amplitude weighting function to obtain the same noise energy as the input white noise.
Examples#
pink noise#
brown noise#
ship noise#
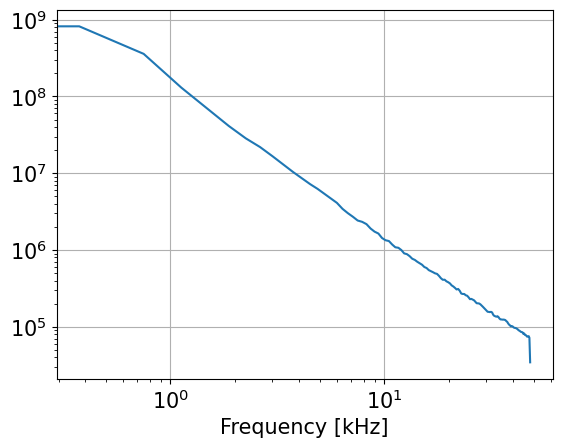
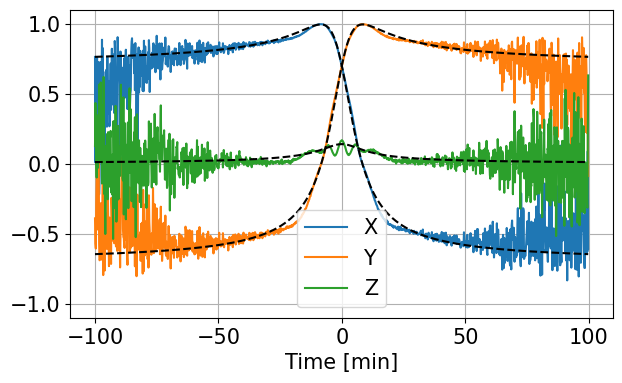
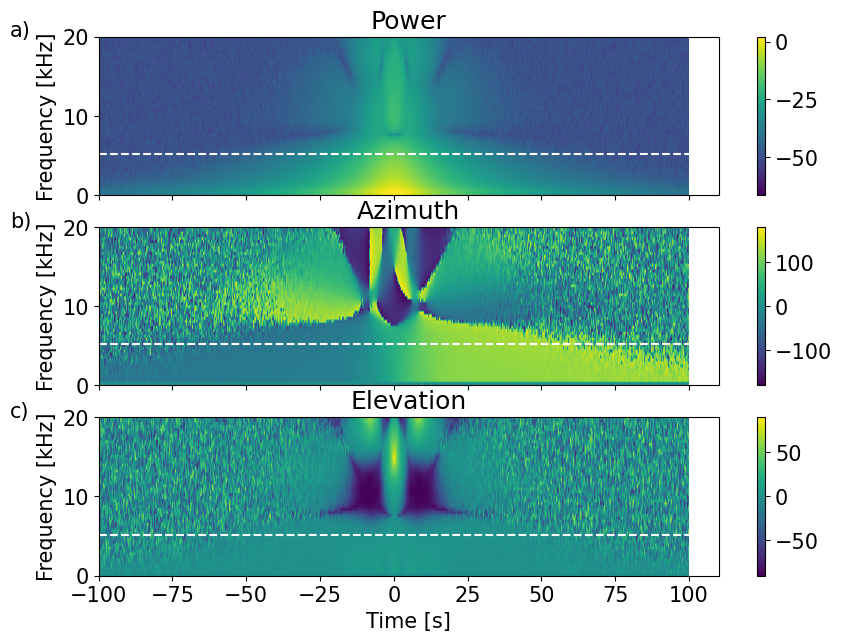
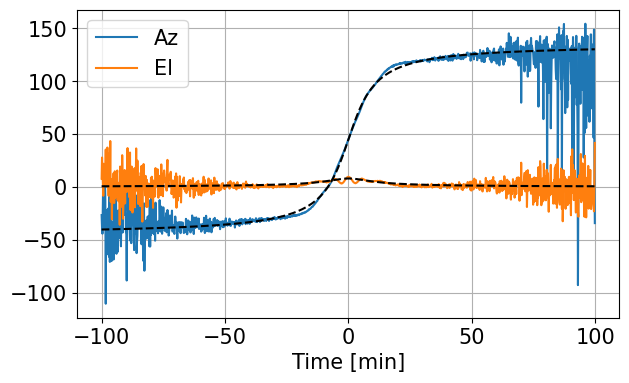
Text book ship spectrum are described as constant below a certain frequency \(fo\) and then to fall off with frequency squared
def shipSpectrum(f,fo):
    return 1/ np.maximum(fo,f)

def genNoise(N,fo,fs,method):
    N2 = N//2+1
    f = np.arange(0,N2)*fs/N
    A2 = method(f,fo)
    A2 /= np.sqrt(np.sum(A2**2))
    n2 = np.random.random(N2)
    p2 = 2*np.pi*n2
    d2 = A2*np.exp(1j*p2)
    x = np.fft.irfft(d2)
    return x

# test
fs=96000
fo=150
xx=[]
for ii in range(100):
    xx=np.append(xx,genNoise(1024,fo,fs,shipSpectrum))
xx *= 1e+9
f,P= signal.welch(xx,axis=0,fs=fs)
#
plt.loglog(f/1000,P)
plt.grid(True)
plt.xlabel('Frequency [kHz]')
plt.show()
# simulate ship track
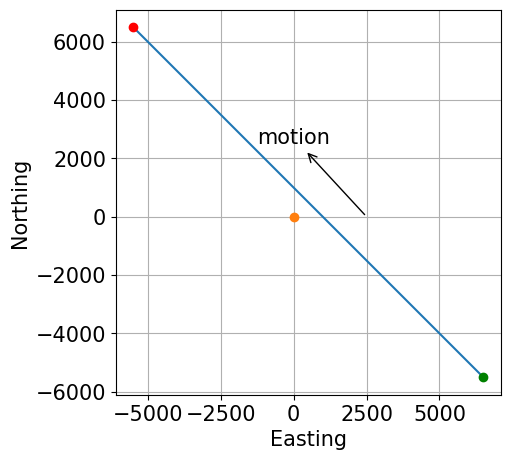
it=np.arange(-6000,6000,10).reshape(-1,1)           # in time in seconds
vv=np.array([-1,1,0])                               # speed in m/s
cp = np.array([500,500,0])                          # closest point of approach
ro = np.array([0,0,-100])                           # recorder location
ss = (cp-ro)+vv*it                                  # relative source location
rr=np.sum(ss**2,1)
#
plt.figure(figsize=(5,5))
plt.plot(ss[:,0],ss[:,1])
plt.plot(0,0,'o')
plt.plot(ss[0,0],ss[0,1],'go')
plt.plot(ss[-1,0],ss[-1,1],'ro')
plt.grid(True)
plt.gca().set_aspect('equal')
plt.xlabel('Easting')
plt.ylabel('Northing')
plt.annotate("motion",
            xy=(2500, 0),
            xytext=(0, 2500),
            arrowprops=dict(arrowstyle="<-"),horizontalalignment='center' )
plt.show()
# simulate and process ship noise
nw=256
nfft=nw
fs=96000
fo=150
M=np.zeros((nfft//2+1,len(it),3))
for nn in range(len(it)):
    #
    xx=[]
    for ii in range(100):
        xx=np.append(xx,genNoise(1024,fo,fs,shipSpectrum))
    xx *= 1e+9/rr[nn]
    #
    ## simulate delay
    S=ss[nn,:]/np.sqrt(rr[nn])
    DS,DT=array_delay(S,ho,fs)
    if nn==0: print(DS)
    #
    noise=0.1
    yy=sim_array(xx,DS,noise)[100:fs+100,:]

    f,t,I=getIntensity(yy,DI,hsel,fs,nw,nfft)
    #
    M[:,nn,:]=np.mean(I,1)
    #
    #if nn%100 ==0: print(nn,xx.std(),yy.std(),20*np.log10(xx.std()/noise))
#

Mn=np.sqrt(np.sum(M**2,2))
Mn[ 0,:]=Mn[ 1,:]
Mn[-1,:]=Mn[-2,:]
K=M/Mn.reshape(M.shape[0],M.shape[1],1)
[ 3.50333766 -3.58039855 3.03549577 -2.95843487]
tx=it/60            # minutes
yl=[0,20]
ext=[tx[0],tx[-1],f[0]/1000,f[-1]/1000]
#
labels=['X','Y','Z']
fig, ax = plt.subplots(4, 1, num=0, clear=True, sharex=True, figsize=(10,12))
im=ax[0].imshow(10*np.log10(Mn),aspect='auto',origin='lower',extent=ext)
ax[0].set_ylim(yl)
ax[0].hlines(0.75/Lm,tx[0],tx[-1],colors='w',linestyles='--')
ax[0].set_ylabel('Frequency [kHz]')
ax[0].set_title('Intensity')
plt.colorbar(im)
#
for ii in range(3):
    im=ax[1+ii].imshow(K[:,:,ii],aspect='auto',origin='lower',extent=ext,clim=[-1,1])
    ax[1+ii].set_ylim(yl)
    ax[1+ii].hlines(0.75/Lm,tx[0],tx[-1],colors='w',linestyles='--')
    ax[1+ii].set_title(labels[ii]+'-component')
    ax[1+ii].set_ylabel('Frequency [kHz]')
    plt.colorbar(im)
#
ax[0].text(-120,20,'a)')
ax[1].text(-120,20,'b)')
ax[2].text(-120,20,'c)')
ax[3].text(-120,20,'d)')
ax[3].set_xlabel('Time [min]')
plt.show()
k1=int(2/96*256)
k2=int(4/96*256)
K2=np.mean(K[k1:k2,:,:],axis=0)
#
plt.figure(figsize=(7,4))
plt.plot(it/60,K2,label=['X','Y','Z'])
plt.plot(it/60,ss/np.sqrt(rr).reshape(-1,1),'k--')
plt.ylim(-1.1,1.1)
plt.xlabel('Time [min]')
plt.grid(True)
plt.legend()
plt.show()
## angle estimations
Azx=180/np.pi*np.arctan2(K[:,:,1],K[:,:,0])
Elx=180/np.pi*np.arctan2(K[:,:,2],np.sqrt(K[:,:,0]**2+K[:,:,1]**2))
#
yl=[0,20]
xto=-130
fig, ax = plt.subplots(3, 1, num=0, clear=True, sharex=True, figsize=(10,7))
im=ax[0].imshow(10*np.log10(np.abs(Mn)),origin='lower', aspect='auto',extent=ext)
ax[0].hlines(0.75/Lm,-100,100,colors='w',linestyles='--')
ax[0].set_ylim(yl)
ax[0].set_ylabel('Frequency [kHz]')
ax[0].set_title('Power')
plt.colorbar(im)
ax[0].text(xto,20,'a)')
#
im=ax[1].imshow(Azx,origin='lower', aspect='auto',extent=ext,clim=(-180,180))
ax[1].hlines(0.75/Lm,-100,100,colors='w',linestyles='--')
ax[1].set_ylim(yl)
ax[1].set_ylabel('Frequency [kHz]')
ax[1].set_title('Azimuth')
plt.colorbar(im)
ax[1].text(xto,20,'b)')
#
im=ax[2].imshow(Elx,origin='lower', aspect='auto',extent=ext,clim=(-90,90))
ax[2].hlines(0.75/Lm,-100,100,colors='w',linestyles='--')
ax[2].set_ylim(yl)
ax[2].set_xlabel('Time [s]')
ax[2].set_ylabel('Frequency [kHz]')
ax[2].set_title('Elevation')
plt.colorbar(im)
ax[2].text(xto,20,'c)')
#
plt.show()
k1=int(2/96*256)
k2=int(4/96*256)
Aze=np.mean(Azx[k1:k2,:],axis=0)
Ele=np.mean(Elx[k1:k2,:],axis=0)
#
Azo=np.arctan2(ss[:,1],ss[:,0])*180/np.pi
Elo=np.arctan2(ss[:,2],np.sqrt(ss[:,0]**2+ss[:,1]**2))*180/np.pi

#
plt.figure(figsize=(7,4))
plt.plot(it/60,Aze,label='Az')
plt.plot(it/60,Ele,label='El')
plt.plot(it/60,Azo,'k--')
plt.plot(it/60,Elo,'k--')
plt.xlabel('Time [min]')
plt.grid(True)
plt.legend()
plt.show()
Time delay direction finding#
Given
and assume that the travel path difference \((\delta R_{ij})\) is based on time-delay estimation
with \(c\) being the sound speed and \((\delta t_{ij})\) the measured time delay of the signal.
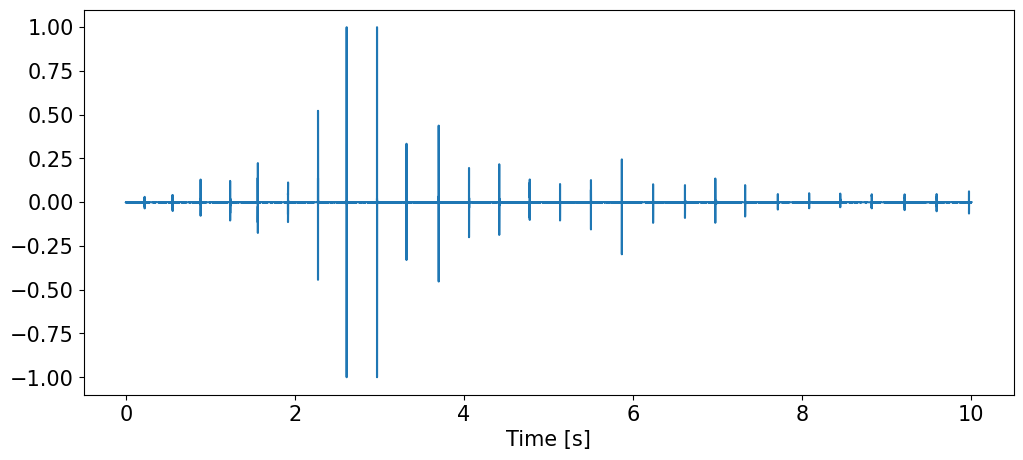
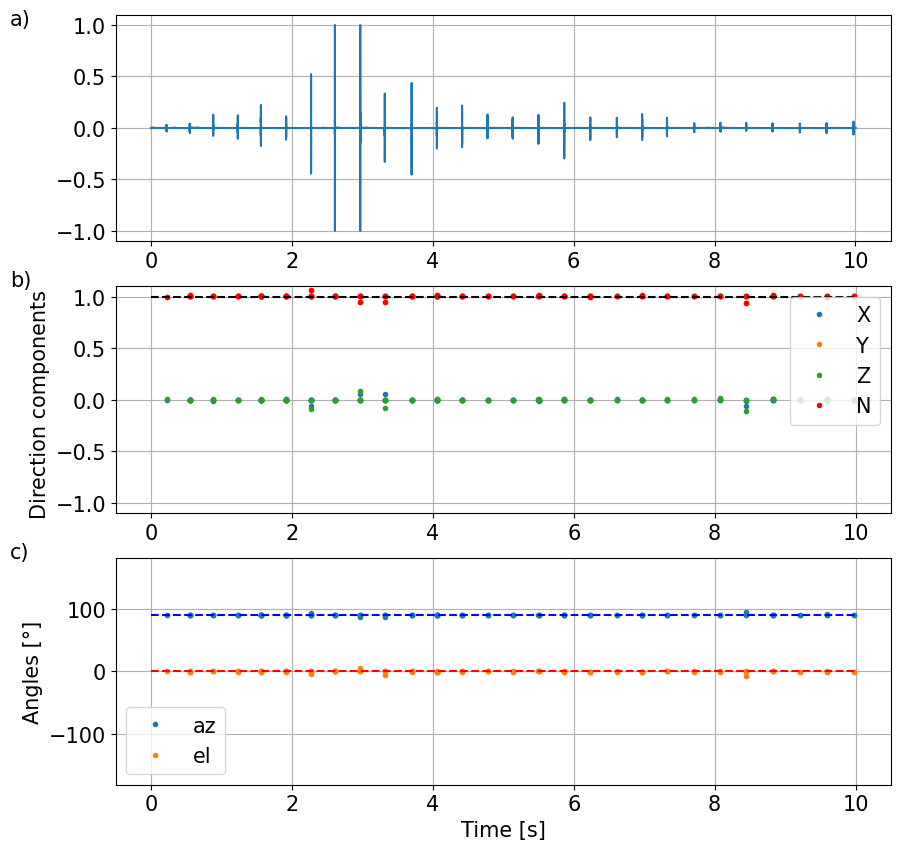
Beaked whale click train#
wav=wv.read("./Data/zc06_204a22410-24210.wav")
fs=wav.rate
print('fs=',fs)
data=wav.data[int(4*fs):int(14*fs),:]/2**15
tt=np.arange(data.shape[0])/fs
#
plt.figure(figsize=(12,5))
plt.plot(tt,data)
plt.xlabel('Time [s]')
plt.show()
fs= 192000
## simulate delay
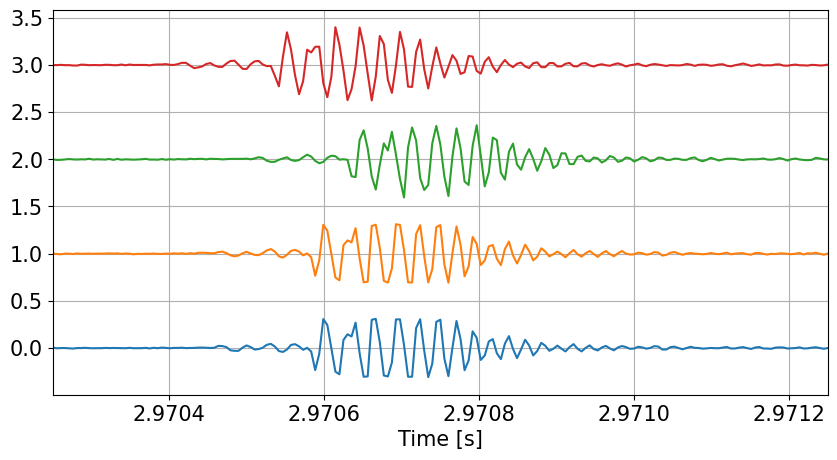
azo=90#-60
elo=0# 60
S =np.array([cosd(azo)*cosd(elo),sind(azo)*cosd(elo), sind(elo)])
DS,DT=array_delay(S,ho,fs)
print(DT, 'ms')
print(DS, 'samples')
[ 2.95956310e-18 -2.95956310e-18 -4.83333333e-02  4.83333333e-02] ms
[ 5.68236115e-16 -5.68236115e-16 -9.28000000e+00  9.28000000e+00] samples
#delay signal according to array geometry
noise=1e-2
ss=sim_array(data,DS,noise)
ts=np.arange(ss.shape[0])/fs
#
def stack(x): return x+np.ones((x.shape[0],1))*range(x.shape[1])

xl=[]
xl=[2.97025,2.97125]
plt.figure(figsize=(10,5))
plt.plot(ts,stack(0.4*ss/np.max(ss)))
plt.grid(True)
if xl != []: plt.xlim(xl)
plt.xlabel('Time [s]')
plt.show()
# check processing
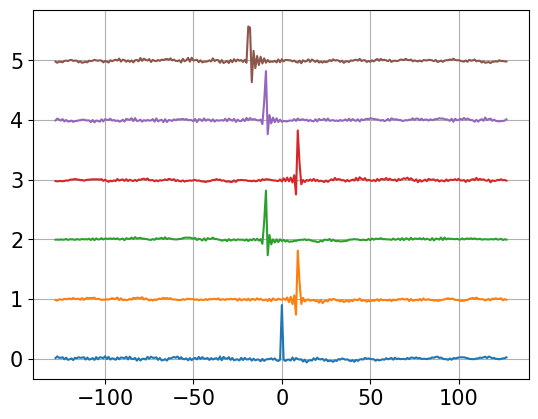
io=int(2.97*fs)
xx=ss[io:io+256,:]
#plt.plot(xx)
#plt.show()
#
uu=np.fft.rfft(xx,axis=0)
vv=uu[:,hsel[:,0]]*np.conjugate(uu[:,hsel[:,1]])
vv /= np.abs(vv)
yy=np.fft.fftshift(np.fft.irfft(vv,axis=0),axes=0)
amx= yy.max(axis=0)
jmx= yy.argmax(axis=0)

plt.plot(range(-128,128),stack(0.9*yy/np.max(yy)))
plt.grid(True)
plt.show()
#
def xcorr(xx,hsel):
    nx=xx.shape[0]
    win=np.hanning(xx.shape[0]).reshape(-1,1)
    uu=np.fft.rfft(xx*win,axis=0)
    vv=uu[:,hsel[:,0]]*np.conjugate(uu[:,hsel[:,1]])
#    vv /= np.abs(vv)
    yy=np.fft.fftshift(np.fft.irfft(vv,axis=0),axes=0)
    amx= yy[1:-1].max(axis=0)
    jmx= yy[1:-1].argmax(axis=0)+1
    #
    ux=quadInt(yy,jmx,128)
    return amx,jmx,ux
#
def tdoa(ss,DI,hsel):
    # process all data in small chunks
    offsets=np.arange(0,ss.shape[0]-256,64,dtype=int)
    imx=np.zeros((len(offsets),hsel.shape[0]),dtype=int)
    amx=np.zeros((len(offsets),hsel.shape[0]))
    ux =np.zeros((len(offsets),hsel.shape[0],2))
    #
    jj=0
    for ii in offsets:
        xx=ss[ii:ii+256,:]
        amx[jj,:],imx[jj,:],ux[jj,:,:]=xcorr(xx,hsel)
        jj += 1
    #
    # project delays to 3-d coordinates
    V=-ux[:,:,0]@DI.T
    V *= 1500/fs
    return V,ux,offsets
#
V,ux,offsets = tdoa(ss,DI,hsel)
#
print(ux.shape)
imx1=ux[:,:,0]
amx1=ux[:,:,1]
#
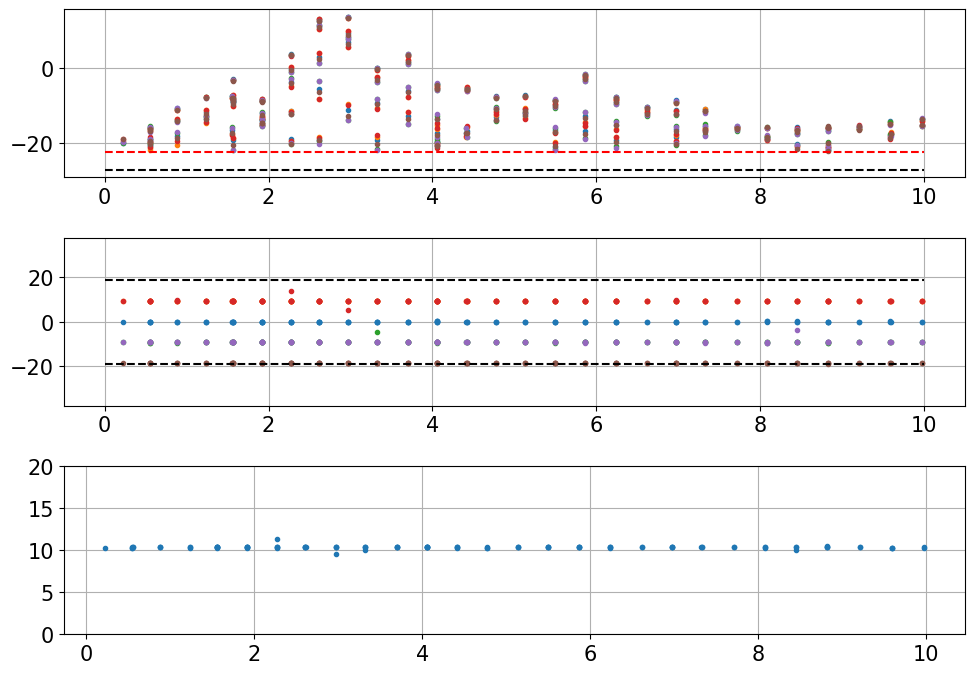
dn=np.ceil(np.max(L)/1500*fs)
print(dn)
td=ts[offsets]
#
#thr=amx1.mean()+1*amx1.std()
thr=3
idet=np.all(amx1>thr*np.median(amx1),axis=1)
print(idet.shape)
#
xl=[]
plt.figure(figsize=(10,7),layout='tight')
plt.subplot(311)
plt.plot(td[idet],10*np.log10(amx1[idet,:]),'.')
plt.hlines(10*np.log10(np.median(amx1)),td[0],td[-1],linestyles='--',color='k')
plt.hlines(10*np.log10(thr*np.median(amx1)),td[0],td[-1],linestyles='--',color='r')
plt.grid(True)
if xl !=[]: plt.xlim(xl)
#
plt.subplot(312)
plt.plot(td[idet],imx1[idet,:],'.')
if xl !=[]: plt.xlim(xl)
plt.hlines(+dn,td[0],td[-1],linestyles='--',color='k')
plt.hlines(-dn,td[0],td[-1],linestyles='--',color='k')
plt.grid(True)
plt.ylim(-2*dn,+2*dn)
#
plt.subplot(313)
plt.plot(td[idet],imx1[idet,:].std(axis=1),'.')
plt.ylim(0,20)
plt.grid(True)
if xl !=[]: plt.xlim(xl)
plt.show()
(29996, 6, 2)
19.0
(29996,)
print(V.shape)
#
az=np.arctan2(V[:,1],V[:,0])*180/np.pi
el=np.arctan2(V[:,2],np.sqrt(V[:,0]**2+V[:,1]**2))*180/np.pi
#
Vn=np.sqrt(np.sum(V**2,1))
jdet=idet & (np.abs(Vn-1)<1)
#
plt.figure(figsize=(10,10))
plt.subplot(311)
plt.plot(ts,data)
plt.grid(True)
plt.text(-2,1,'a)')

plt.subplot(312)
plt.plot(td[jdet],V[jdet,:],'.',label={'X','Y','Z'})
plt.plot(td[jdet],Vn[jdet],'r.',label='N')
plt.hlines(1,td[0],td[-1],linestyles='--',color='k')
plt.ylim(-1.1,1.1)
plt.ylabel('Direction components ' )
plt.legend()
plt.text(-2,1.1,'b)')
plt.grid(True)

plt.subplot(313)
plt.plot(td[jdet],az[jdet],'.', label='az')
plt.plot(td[jdet],el[jdet],'.', label='el')
plt.hlines(azo,td[0],td[-1],linestyles='--',color='b')
plt.hlines(elo,td[0],td[-1],linestyles='--',color='r')
plt.ylim(-180,180)
plt.legend()
plt.grid(True)
plt.ylabel('Angles [°]' )
plt.xlabel('Time [s]' )
plt.text(-2,180,'c)')
plt.show()
(29996, 3)
Beamforming#
Basic formulation of beamforming#
Let the sound pressure measured an a single hydrophone be a signal \(s\)
then in an array of hydrophones the measurements become
where \(\tau_i(\alpha,\beta)\) is the delay of the signal at hydrophone \(i\) with respect to som reference hydrophone and \(\alpha,\beta\) are the angles of arrival
Line array#
For a line array with equally spaced hydrophones the delay has a simple form
where \(d\) id the hydrophone spacing, \(c\) is the sound speed at the hydrophone, and \(\gamma\) is the relative angle of arrival, that for a line array is composed of the azimuth \(\alpha\) and elevation angle \(\beta\).
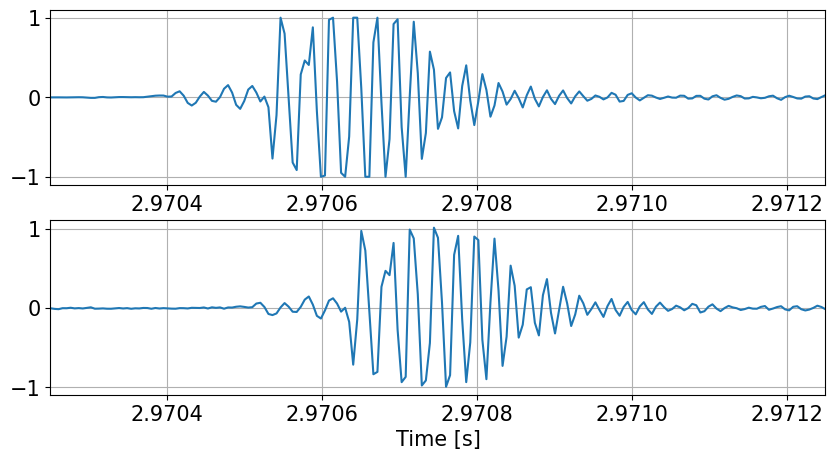
The beamforming algorithm simply speaking tries to undo the signal delays \(\tau_i(\alpha,\beta)\) by compensating with negative delays
In cases, where \(\delta_i(\gamma)=\tau_i(\alpha,\beta)\) we get
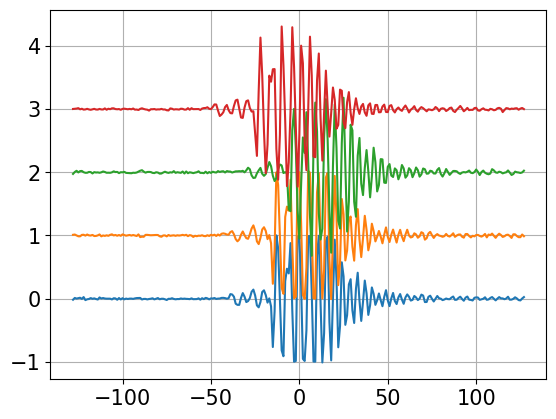
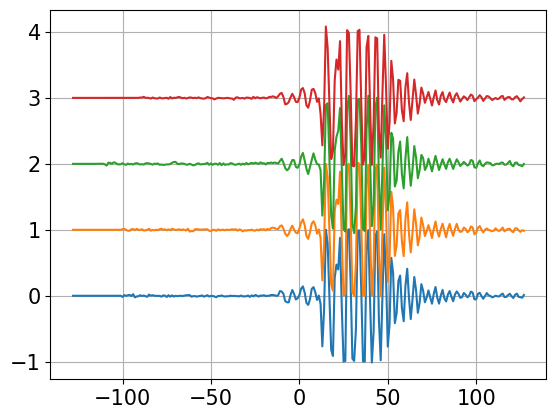
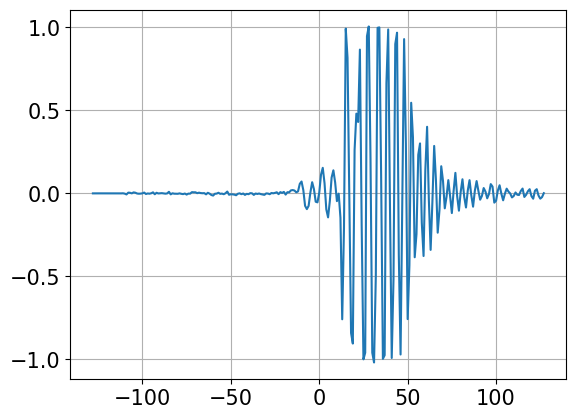
indicating that the signal \(s(t)\) is completely reconstructed and that noise, that is assumed to be uncorrelated is attenuated.
In all other cases also the signal is attenuated die to delay mismatch.
delay estimation from angles#
This operation is opposite to the simulation of measurements using azimuth and elevation angles.
In particular, given a source direction \(s\) that is obtaind from azimuth and elevation angles
then the number of fractional samples \(\delta N_{ij}\) needed to align the arriving time series is estimated by
General beam steering#
A general application of beamforming, where the signal direction is unknown, will vary the steaaring vector \(s\) to cover all possible directions resulting in \(N_\alpha \times N_\beta\) directions, where \(N_\alpha, N_\beta\) are the numbers of different azimuth and elevation directions.
def beamForm(yy,DS):
    # delay signal according to array geometry
    # (use fractional delay with sinc function)
    kk=np.arange(-10,10,1);
    ss=np.zeros((len(yy),len(DS)))
    # delay
    for ii in range(len(DS)):
        ss[:,ii]=fft_filt(np.sinc(kk-DS[ii]),yy[:,ii])[:,0]
    # average
    zz=np.mean(ss,1)
    return zz
aze=np.mean(az[jdet],0)
ele=np.mean(el[jdet],0)
print('az =',aze, '  el =',ele)
Se =np.array([cosd(aze)*cosd(ele),sind(aze)*cosd(ele), sind(ele)])
DSe,DTe=array_delay(Se,ho,fs)
zz=beamForm(ss,DS)

xl=[]
xl=[2.97025,2.97125]
plt.figure(figsize=(10,5))
plt.subplot(211)
plt.plot(tt,data);
plt.grid(True)
if xl != []: plt.xlim(xl)

plt.subplot(212)
plt.plot(ts,zz);
plt.grid(True)
if xl != []: plt.xlim(xl)
plt.xlabel('Time [s]')
plt.show()
az = 90.04560065380026 el = -0.1022210630355344
General fft-based direction finding#
Noting that power spectrum, cross correlation and intensity estimation are using ffts, it should be possible to combine the three operation.
class MC:
    def __init__(self,ho,hsel,sv):
        D=ho[hsel[:,0],:]-ho[hsel[:,1],:]
        DI=np.linalg.pinv(D)
        self.ho=ho
        self.hsel=hsel
        self.sv=sv
        self.D=D
        self.DI=DI
    #
    def __str__(self):
        return "Multi-Channel direction finding using fft"
    #
    def __quadInt__(self,uu,imx,nd1):
        # three point quardatic interpolation
        # to find location and value of interpolated maxima
        nc=len(imx)
        uo=uu[imx,range(nc)]
        um=uu[imx-1,range(nc)]
        up=uu[imx+1,range(nc)]
        #
        b=(up+um-2*uo)/2;
        #
        xo=(um-up)/(4*b);
        yo=uo-b*xo**2;
        #
        ux=np.zeros((nc,2))
        ux[:,0]=xo+imx-nd1
        ux[:,1]=yo
        return ux
    #
    def __proc_fft__(self,xx,nfft):
        hsel=self.hsel
        uu=np.fft.rfft(xx*self.win,axis=0,n=nfft)
        vv=uu[:,hsel[:,0]]*np.conjugate(uu[:,hsel[:,1]])
        vv = vv/np.abs(vv)
        yy=np.fft.fftshift(np.fft.irfft(vv,axis=0),axes=0)

        jmx= yy[1:-1,:].argmax(axis=0)+1
        ux=self.__quadInt__(yy,jmx,nfft//2)
        return uu, -vv.imag, ux

    def process(self,ss,fs,nw,step,nfft):
        nd,nch=ss.shape
        offsets=np.arange(0,nd-nw,step,dtype=int)
        no = offsets.shape[0]
        nh = self.hsel.shape[0]
        nfr=1+nfft//2
        Q  = np.zeros((no,nfr,nch),dtype='complex')
        C  = np.zeros((no,nfr,nh))
        ux = np.zeros((no,nh,2))
        self.win=np.hanning(nw).reshape(-1,1)
        #
        for ii,jj in zip(offsets,range(no)):
            xx=ss[ii:ii+nw,:]
            Q[jj,:,:],C[jj,:,:],ux[jj,:,:]=self.__proc_fft__(xx,nfft)
        #
        # accumulate 3-d components
        V=-ux[:,:,0]@self.DI.T
        I=-C@self.DI.T
        #
        t=(offsets+nw//2)/fs
        f=np.arange(nfr)*fs/nfft
        return Q,I,V,ux,f,t

    def directions(self,ss,fs,nw,step,nfft):
        Q,I,V,ux,f,t=self.process(ss,fs,nw,step,nfft)
        P=np.abs(Q)
        #
        In=np.sqrt(np.sum(I**2,2))
        In[:,0]=In[:,1]
        In[:,-1]=In[:,-2]
        J=I/In.reshape(In.shape[0],In.shape[1],1)
        In[:,0]=0
        In[:,-1]=0

        A=np.mean(ux,axis=1)
        #
        AZ=180/np.pi*np.arctan2(J[:,:,1],J[:,:,0])
        EL=180/np.pi*np.arctan2(J[:,:,2],np.sqrt(J[:,:,0]**2+J[:,:,1]**2))
        az=180/np.pi*np.arctan2(V[:,1],V[:,0])
        el=180/np.pi*np.arctan2(V[:,2],np.sqrt(V[:,0]**2+V[:,1]**2))
        return P,In,A,AZ,EL,az,el,f,t,ux

    def beamform(self,ss,aze,ele,fs,nw,nfft,step=None):
        nd,nch=ss.shape
        Se =np.array([cosd(aze)*cosd(ele),sind(aze)*cosd(ele), sind(ele)])
        DS =np.sum(self.ho*Se,1)*fs/self.sv
        #
        nt=int(np.ceil(3*np.abs(DS).max()))
        kk=np.arange(-nt,1+nt).reshape(-1,1)
        uu=np.sinc(kk-DS)
        vv=np.fft.rfft(uu,n=nfft,axis=0)
        #
        if step==None:
            step=nfft-2*nt
            offsets = range(0, nd, step)
            zz=np.zeros(nd+nfft)
            for nn in offsets:
                xx=ss[nn:nn+nw,:]
                yy=np.fft.rfft(xx,n=nfft,axis=0)
                xv=np.fft.irfft(yy*vv,axis=0)
                zz[nn:nn+nfft] += np.mean(xv,1)
            #
            return zz[nt:nt+nd]
        else:
            if step==0:
                offsets = range(1)
            else:
                offsets = range(0, nd, step)
            no = len(offsets)
            zz=np.zeros((nw,no))
            for nn,jj in zip(offsets,range(no)):
                xx=ss[nn:nn+nw,:]
                yy=np.fft.rfft(xx,n=nfft,axis=0)
                xv=np.fft.irfft(yy*vv,axis=0)
                zzo=xv[:nw,:]
                zz[:,jj] = np.mean(zzo,1)
            return zz,zzo
# tetraheder
ro=0.0725
dz=np.sqrt(0.5)
ho=np.array([[1,0,-dz],[-1,0,-dz],[0,-1,dz],[0,1,dz]])*ro
hsel=np.array([[1,0],[2,0],[3,0],[2,1],[3,1],[3,2]])
#
sv=1500
mc=MC(ho,hsel,sv)
print(mc)
nw=256
step=nw//4
nfft=512
P,In,A,AZ,EL,az,el,f,t,ux=mc.directions(ss,fs,nw,step,nfft)
#print(I.shape,V.shape,P.shape,P.dtype)

if 0:
    ext=[t[0],t[-1],f[0]/1000,f[-1]/1000]
    fig, axs = plt.subplots(5, 1, num=0, clear=True, sharex=True, figsize=(12,16))

    im=axs[0].imshow(10*np.log10(P[:,:,0].T),aspect='auto',origin='lower',extent=ext)
    plt.colorbar(im)
    im=axs[1].imshow(AZ.T,aspect='auto',origin='lower',extent=ext)
    plt.colorbar(im)
    im=axs[2].imshow(EL.T,aspect='auto',origin='lower',extent=ext)
    plt.colorbar(im)

    axs[3].plot(ts,ss/ss.max())
    axs[3].plot(t,A[:,1],'k.-')
    axs[4].plot(t,az,'.-')
    axs[4].plot(t,el,'.-')
    axs[4].plot(t,azo+0*t,'k--')
    axs[4].plot(t,elo+0*t,'k--')
    axs[4].set_ylim(-180,180)
    axs[4].set_xlim(2.97-0.01,2.97+0.01)

    for ax in axs:
        ax.grid(True)

    for ax in axs[:3]:
        ax.set_ylabel('Frequency [kHz]')

    #adjust axes
    ax0=axs[0].axes.get_position()
    for ii in range(3,5):
        ax=axs[ii].axes.get_position()
        ax.x1=ax0.x1
        axs[ii].axes.set_position(ax)

    axs[0].set_title('power')
    axs[1].set_title('Azimuth')
    axs[2].set_title('Elevation')
    axs[3].set_title('xcorr-peak')
    axs[4].set_title('xcorr-components')
    plt.show()
Multi-Channel direction finding using fft
#
io=int(2.97*fs)
xx=ss[io:io+256,:]

#azo,elo
aze=azo
ele=elo

nw=256
nstep=256
nfft=512
zz,zzo=mc.beamform(xx,aze,ele,fs,nw,nfft,0)

plt.plot(range(-128,128),stack(xx))
plt.grid(True)
plt.show()
plt.plot(range(-128,128),stack(zzo))
plt.grid(True)
plt.show()
plt.plot(range(-128,128),zz)
plt.grid(True)
plt.show()
